
$770per kW AC
Capped at $770,000 a project and at 50% of eligible costs.
Main conditions
Load displacement only, panels on a building rooftop, array no larger than the facility’s maximum load.
Ontario·Commercial and industrial solar
Commercial solar in Ontario pays off when the system fits how your facility uses electricity, what your roof and electrical service can carry, and which incentives your design qualifies for. Green Integrations is a commercial and industrial solar installer working across the province, with completed systems from 13.7 kW at Bentinck Packers in Hanover to 1.27 MW at Rabba Fine Foods in Mississauga.
You see the financial model before you commit.
Overview
Four things shape an Ontario commercial solar decision. Each one is modelled from your facility’s data before you commit.
Roof condition, the electrical service and what the utility needs for the connection all move the price, and they can also cap the size.
CostFederal tax measures and the Save on Energy program can be stacked on one project.
IncentivesLoad displacement or net metering — only one of the two earns the Save on Energy incentive. Your local utility confirms available capacity.
Net metering or load displacementHigh daytime load and access to incentives move a facility toward the lower end of the payback range, and your Global Adjustment class changes the ROI too.
ReturnsCost
For systems above 100 kW DC, an Ontario commercial rooftop solar project costs $1.50 to $2.50 per watt DC before incentives.
The building decides where a project lands in that range. Roof condition, the electrical service and what the utility needs for the connection all move the price, and they can also cap the size. See what commercial solar panels cost in Canada for the breakdown by system size.
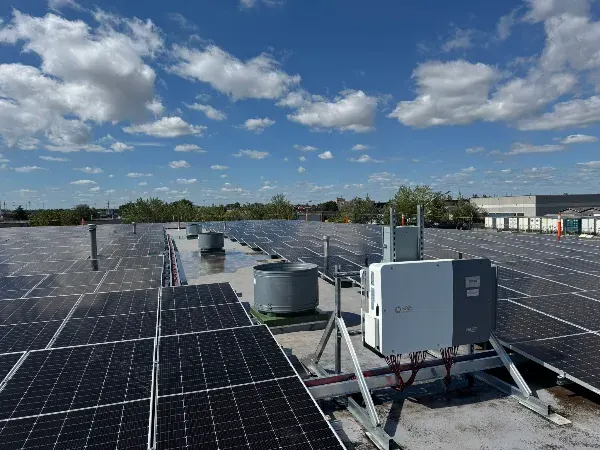
At Elton Manufacturing in Mississauga, the roof set the array at 741.97 kW DC and the electrical service held the connection to 495 kW AC.
| System size (DC) | Installed cost before incentives | Range on a $0–$2.5M scale |
|---|---|---|
| 100 kW | $150,000 to $250,000 | |
| 250 kW | $375,000 to $625,000 | |
| 500 kW | $750,000 to $1,250,000 | |
| 1 MW | $1,500,000 to $2,500,000 |
Utility strategy
Decide this first, because only one of the two earns the Save on Energy incentive. The commercial solar installation page compares the two side by side.
NeutralWhich one fits your facility is determined during modelling.
Incentives
Ontario offers one of the strongest incentive environments in Canada. Federal tax measures and the Save on Energy program can be stacked on one project and, with energy market programs, offset up to 75% of eligible project costs.
Capped at $770,000 a project and at 50% of eligible costs.
Load displacement only, panels on a building rooftop, array no larger than the facility’s maximum load.
Refundable credit.
Applied after rebates are deducted; covers solar PV, battery storage and related electrical infrastructure.
Deduction in the first year of operation.
Based on net asset cost after rebates and tax credits.
Save on Energy updates the program twice a year, and the solar rate fell from $860 to $770 per kW AC on June 30, 2026. A complete application secures the rate in force when it is submitted, so it goes in as early as the project allows. Our rebates and incentives page lists the other programs by province.
A 650 kW DC system with 500 kW AC of inverter capacity, at $2.00 per watt, under load displacement:
The first-year CCA deduction then applies to the $640,500.
The same system under net metering has no Save on Energy incentive, so the ITC applies to the full $1,300,000 and the cost after the credit is $910,000, with bill credits for surplus solar in return.
Your own figures come from the assessment.
Your project will be modelled using your facility’s actual data.
Start your assessmentReturns
Completed Green Integrations projects pay back in 4.6 to 7.6 years, with a project IRR of 15 to 30%.
Payback on completed projects
Project IRR on completed projects
These are completed-project results. Your project’s return is calculated from your own electricity data.
Ce De Candy’s 11-project program reached a blended payback of 4.6 years and more than $7M in lifetime savings.
View projectAt Vicwest in Stratford, three funding streams delivered $509,000 in incentives on one project.
View projectHigh daytime load and access to incentives move a facility toward the lower end of the range, and your Global Adjustment class changes the ROI too. Our guide to how much a business can save breaks down the savings.
Global Adjustment is charged differently to Class A and Class B facilities, so solar affects each one differently.
Most mid-sized plants, warehouses and institutions
Global Adjustment follows monthly consumption. Solar used on site cuts the electricity you buy from the grid, which can reduce the consumption that Global Adjustment applies to.
Global Adjustment followsMonthly consumption
Average monthly peak above 1 MW · manufacturers and greenhouses above 500 kW
Global Adjustment follows your share of Ontario demand in the five system peak hours. Solar helps when it is producing in those hours, so we model the saving instead of assuming it, and battery storage can be dispatched for those hours where the load supports it.
Global Adjustment followsShare of demand in the five system peak hours
ModelledGreen Integrations models the applicable tariff and Global Adjustment treatment rather than assuming a uniform solar saving. See how Ontario’s electricity market affects commercial solar.
Featured Ontario project
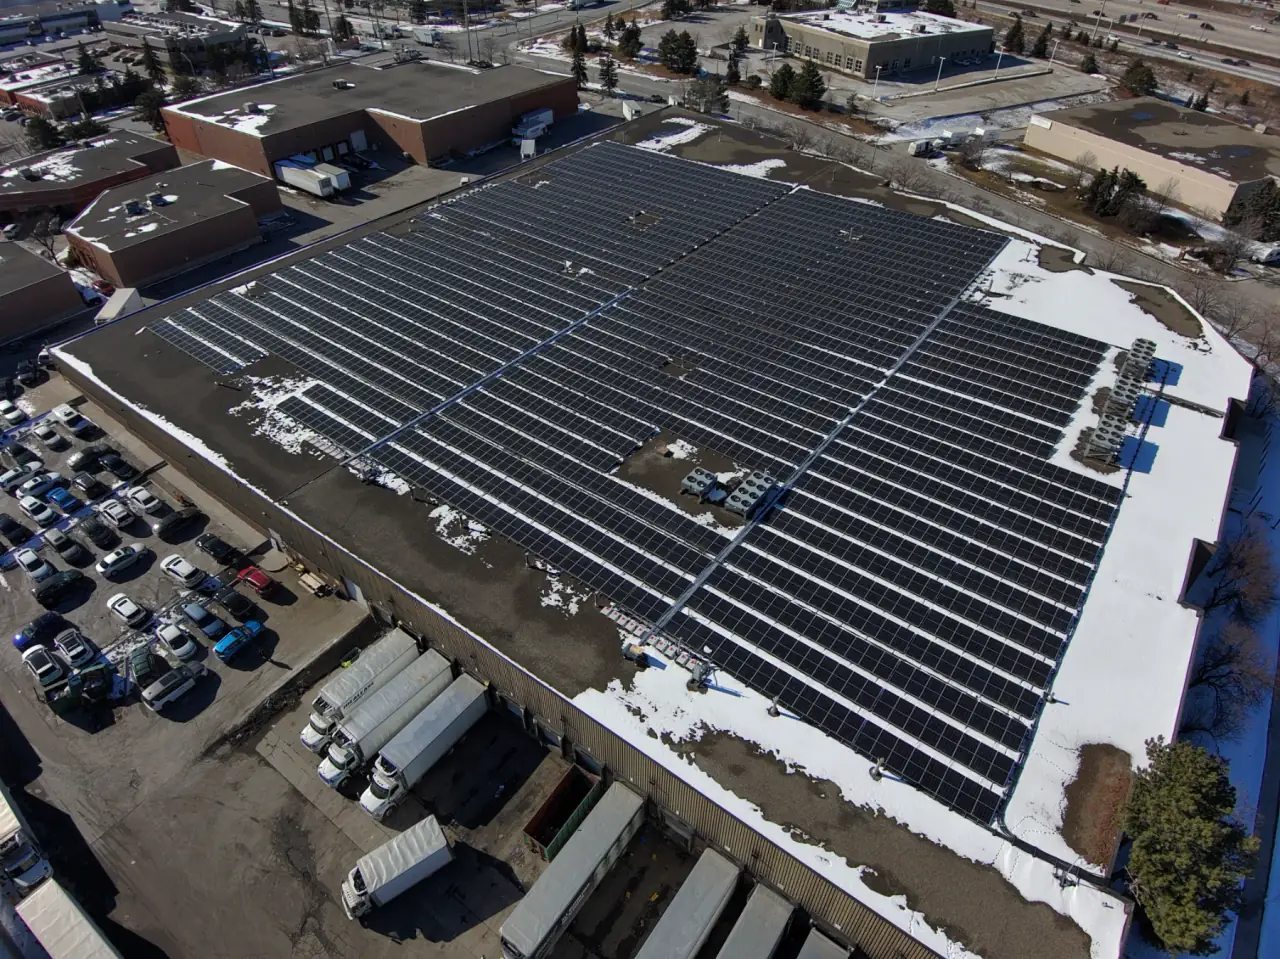
Our largest completed Ontario system, net-metered, on the Rabba Fine Foods distribution centre roof.
Projects
These Ontario facilities run commercial solar panels today. Each project page has the full figures.
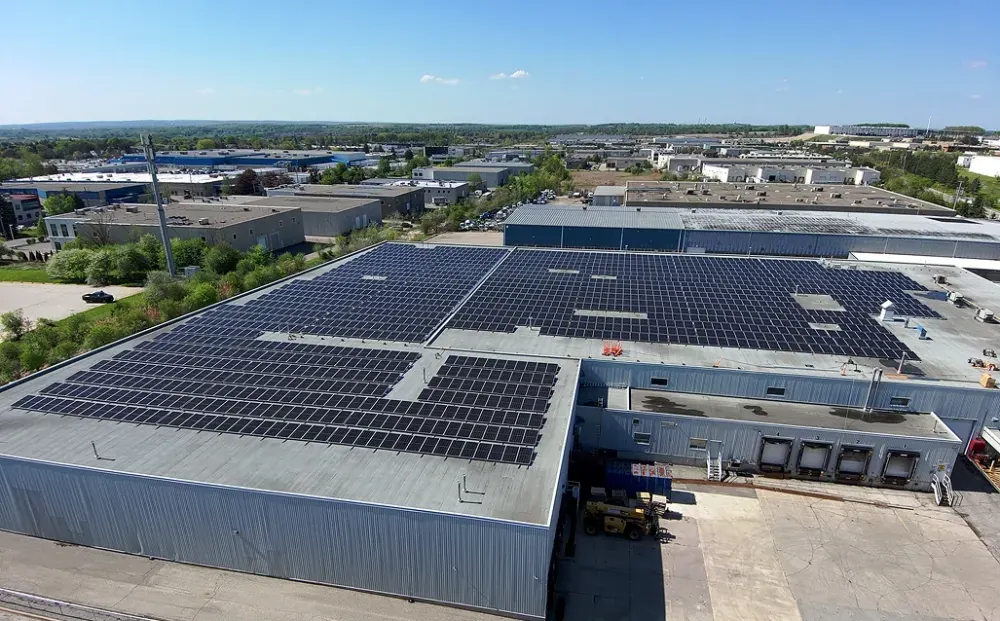
Ce De Candy’s 11-project program reached a blended payback of 4.6 years and more than $7M in lifetime savings.
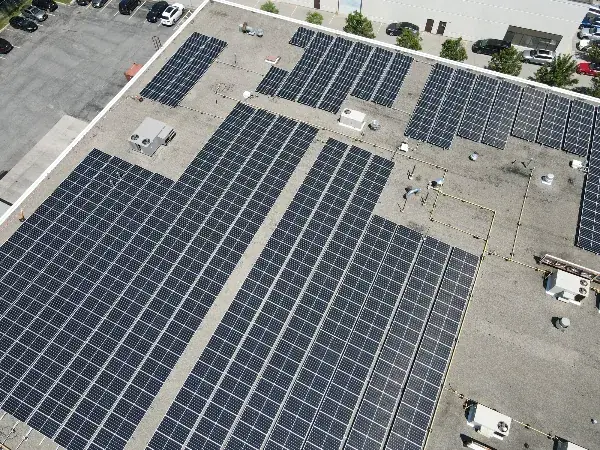
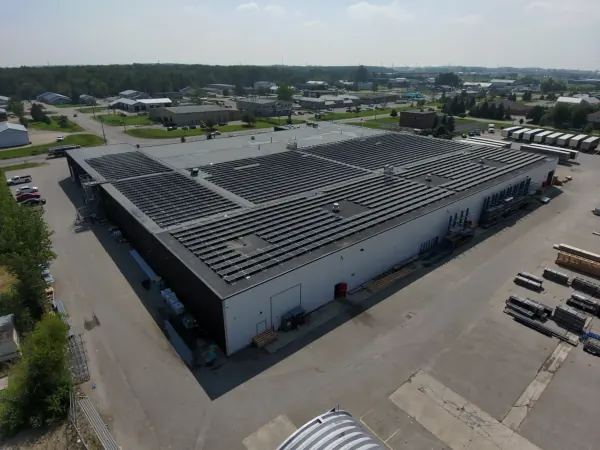
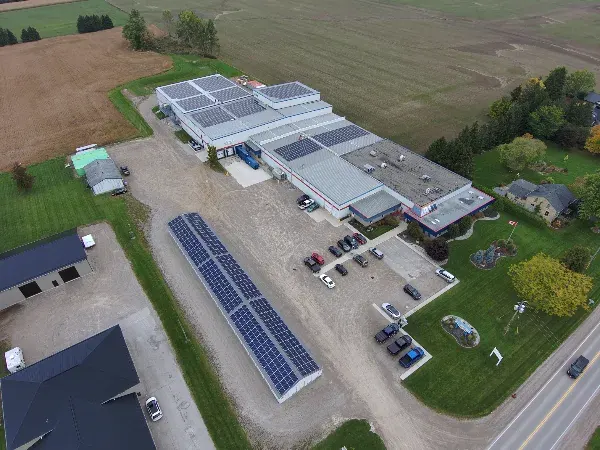
Oakville · 353.8 kW · 396,701 kWh · 50.87% offset
Brantford · 262.6 kW · 278,205 kWh · 50.4% offset
Tilbury · 124.7 kW · 152,013 kWh · 99.4% offset
Barrie · 64.96 kW · 75,152 kWh · 99.7% offset
| Project | Location | System size (DC) | Annual production | Electricity offset |
|---|---|---|---|---|
| Rabba Fine Foods | Mississauga | 1,271 kW | 1,412,187 kWh | |
| Ce De Candy | Newmarket | 966 kW | 1,142,549 kWh | |
| Elton Manufacturing | Mississauga | 741.97 kW | 833,995 kWh | |
| Sunny Crunch Foods | Markham | 593.3 kW | 613,400 kWh | |
| Vicwest Building Products | Stratford | 590.2 kW | 719,855 kWh | |
| Syfilco | Exeter | 504 kW | 721,864 kWh | |
| Budds’ Collision Services | Oakville | 353.8 kW | 396,701 kWh | |
| Canadian Babbitt Bearings | Brantford | 262.6 kW | 278,205 kWh | |
| H&H Wood Products | Tilbury | 124.7 kW | 152,013 kWh | |
| Belt Conveyor Guarding | Barrie | 64.96 kW | 75,152 kWh |
Figures shown are as published on each project page.
See all projectsIndustries
What matters is the load: how much electricity the facility uses while the array is producing.
Load characteristicProduction load runs through the solar day.
Load characteristicRefrigeration and processing keep demand high and predictable.
Load characteristicMaterial handling and extended hours keep demand steady.
Load characteristicFarms can also apply to the federal Agricultural Clean Technology Program when its funding rounds open.
Planning lensOwners plan rooftop solar around operating costs and asset value.
Beyond the array
Where lighting, HVAC or controls can be improved, an energy audit comes first, so the array is sized to a lower baseline.
Utility bills and interval data.
An energy audit for lighting, HVAC or controls.
Solar sized to the facility’s load, roof and electrical service.
Battery storage where the load supports it.
Measurement and verification, then solar maintenance.
Process
Six stages, with the Ontario utility, incentive and ESA steps built in.
We start with your utility bills and interval data and model savings, incentives and system size at no cost. Where lighting, HVAC or controls can be improved, an energy audit comes first, so the array is sized to a lower baseline.
Your local distribution company, such as Toronto Hydro, Alectra, Hydro One or Hydro Ottawa, confirms the capacity available at your address. Limited capacity can mean upgrades that affect timing and cost.
The Save on Energy application goes in before any purchase order or other binding commitment, and you have 24 months from pre-approval to finish the project.
Structural and electrical engineering, permits and the utility’s connection impact assessment for systems above 12 kW.
ESA-licensed electricians install the system, followed by ESA inspection and utility sign-off. Grid connection typically takes 8 to 16 weeks and runs alongside construction where possible.
You get a measurement and verification report at 6 and 12 months after commissioning, solar maintenance keeps the system producing, and the same engineer stays with the project from audit through year 25.
Your facility
Send us your utility bills and we will model incentives, system size and payback for your building at no cost.
No commitment required.
You sendUtility bills and interval data
We modelFAQs
Not covered here? A 20-minute call with an engineer usually answers it.
For a facility with steady daytime load, a roof with years of life left and room on its electrical service, yes. The panels carry a 30-year performance warranty, so the system keeps producing long after it has paid for itself.
Most of our completed Ontario systems produce about 1,050 to 1,250 kWh a year for each kW DC installed, so a 500 kW system makes roughly 525,000 to 625,000 kWh. Orientation, tilt and shading set the figure for each roof.
Yes. It has been available province-wide through the Prescriptive stream of the Retrofit program since January 2025, for commercial, industrial and institutional facilities. Your local utility still has to approve the connection.
No. The Home Renovation Savings program is for homeowners. Businesses use the Save on Energy Retrofit program and the two federal tax measures.
No. Panels have to be mounted on a building rooftop, and wall-mounted systems are no longer eligible. A ground-mount system like R Brush Farms in Blenheim falls outside the incentive, and the federal tax credit and first-year CCA can still apply.
Yes, with the owner’s consent. Save on Energy accepts lessees who have the owner’s authorization to take part.
The difference is scale, electrical design and approvals. A commercial system is sized to a facility’s load and tied into its electrical service, and above 12 kW it goes through the local utility’s connection impact assessment.
Ask for named Ontario projects with system size, production and offset. Ask for a financial model built from your own interval data, and find out who handles the Save on Energy application, the utility connection and the ESA inspection. Then ask who stays responsible after commissioning.
Send us your utility bills and we will model incentives, system size and payback for your building at no cost. We use your facility’s actual utility information to determine: